TABLE 1 Global Lignin Market By Feedstock, 2022-2032, USD (Million)
TABLE 2 Global Lignin Market By Production Process, 2022-2032, USD (Million)
TABLE 3 Global Lignin Market By Carbon Fiber, 2022-2032, USD (Million)
TABLE 4 Global Lignin Market By Carbon Nanofiber, 2022-2032, USD (Million)
TABLE 5 Global Lignin Market By Application, 2022-2032, USD (Million)
TABLE 6 Global Lignin Market By End-Use, 2022-2032, USD (Million)
TABLE 7 North America Lignin Market By Feedstock, 2022-2032, USD (Million)
TABLE 8 North America Lignin Market By Production Process, 2022-2032, USD (Million)
TABLE 9 North America Lignin Market By Carbon Fiber, 2022-2032, USD (Million)
TABLE 10 North America Lignin Market By Carbon Nanofiber, 2022-2032, USD (Million)
TABLE 11 North America Lignin Market By Application, 2022-2032, USD (Million)
TABLE 12 North America Lignin Market By End-Use, 2022-2032, USD (Million)
TABLE 13 U.S. Lignin Market By Feedstock, 2022-2032, USD (Million)
TABLE 14 U.S. Lignin Market By Production Process, 2022-2032, USD (Million)
TABLE 15 U.S. Lignin Market By Carbon Fiber, 2022-2032, USD (Million)
TABLE 16 U.S. Lignin Market By Carbon Nanofiber, 2022-2032, USD (Million)
TABLE 17 U.S. Lignin Market By Application, 2022-2032, USD (Million)
TABLE 18 U.S. Lignin Market By End-Use, 2022-2032, USD (Million)
TABLE 19 Canada Lignin Market By Feedstock, 2022-2032, USD (Million)
TABLE 20 Canada Lignin Market By Production Process, 2022-2032, USD (Million)
TABLE 21 Canada Lignin Market By Carbon Fiber, 2022-2032, USD (Million)
TABLE 22 Canada Lignin Market By Carbon Nanofiber, 2022-2032, USD (Million)
TABLE 23 Canada Lignin Market By Application, 2022-2032, USD (Million)
TABLE 24 Canada Lignin Market By End-Use, 2022-2032, USD (Million)
TABLE 25 Rest of North America Lignin Market By Feedstock, 2022-2032, USD (Million)
TABLE 26 Rest of North America Lignin Market By Production Process, 2022-2032, USD (Million)
TABLE 27 Rest of North America Lignin Market By Carbon Fiber, 2022-2032, USD (Million)
TABLE 28 Rest of North America Lignin Market By Carbon Nanofiber, 2022-2032, USD (Million)
TABLE 29 Rest of North America Lignin Market By Application, 2022-2032, USD (Million)
TABLE 30 Rest of North America Lignin Market By End-Use, 2022-2032, USD (Million)
TABLE 31 UK and European Union Lignin Market By Feedstock, 2022-2032, USD (Million)
TABLE 32 UK and European Union Lignin Market By Production Process, 2022-2032, USD (Million)
TABLE 33 UK and European Union Lignin Market By Carbon Fiber, 2022-2032, USD (Million)
TABLE 34 UK and European Union Lignin Market By Carbon Nanofiber, 2022-2032, USD (Million)
TABLE 35 UK and European Union Lignin Market By Application, 2022-2032, USD (Million)
TABLE 36 UK and European Union Lignin Market By End-Use, 2022-2032, USD (Million)
TABLE 37 UK Lignin Market By Feedstock, 2022-2032, USD (Million)
TABLE 38 UK Lignin Market By Production Process, 2022-2032, USD (Million)
TABLE 39 UK Lignin Market By Carbon Fiber, 2022-2032, USD (Million)
TABLE 40 UK Lignin Market By Carbon Nanofiber, 2022-2032, USD (Million)
TABLE 41 UK Lignin Market By Application, 2022-2032, USD (Million)
TABLE 42 UK Lignin Market By End-Use, 2022-2032, USD (Million)
TABLE 43 Germany Lignin Market By Feedstock, 2022-2032, USD (Million)
TABLE 44 Germany Lignin Market By Production Process, 2022-2032, USD (Million)
TABLE 45 Germany Lignin Market By Carbon Fiber, 2022-2032, USD (Million)
TABLE 46 Germany Lignin Market By Carbon Nanofiber, 2022-2032, USD (Million)
TABLE 47 Germany Lignin Market By Application, 2022-2032, USD (Million)
TABLE 48 Germany Lignin Market By End-Use, 2022-2032, USD (Million)
TABLE 49 Spain Lignin Market By Feedstock, 2022-2032, USD (Million)
TABLE 50 Spain Lignin Market By Production Process, 2022-2032, USD (Million)
TABLE 51 Spain Lignin Market By Carbon Fiber, 2022-2032, USD (Million)
TABLE 52 Spain Lignin Market By Carbon Nanofiber, 2022-2032, USD (Million)
TABLE 53 Spain Lignin Market By Application, 2022-2032, USD (Million)
TABLE 54 Spain Lignin Market By End-Use, 2022-2032, USD (Million)
TABLE 55 Italy Lignin Market By Feedstock, 2022-2032, USD (Million)
TABLE 56 Italy Lignin Market By Production Process, 2022-2032, USD (Million)
TABLE 57 Italy Lignin Market By Carbon Fiber, 2022-2032, USD (Million)
TABLE 58 Italy Lignin Market By Carbon Nanofiber, 2022-2032, USD (Million)
TABLE 59 Italy Lignin Market By Application, 2022-2032, USD (Million)
TABLE 60 Italy Lignin Market By End-Use, 2022-2032, USD (Million)
TABLE 61 France Lignin Market By Feedstock, 2022-2032, USD (Million)
TABLE 62 France Lignin Market By Production Process, 2022-2032, USD (Million)
TABLE 63 France Lignin Market By Carbon Fiber, 2022-2032, USD (Million)
TABLE 64 France Lignin Market By Carbon Nanofiber, 2022-2032, USD (Million)
TABLE 65 France Lignin Market By Application, 2022-2032, USD (Million)
TABLE 66 France Lignin Market By End-Use, 2022-2032, USD (Million)
TABLE 67 Rest of Europe Lignin Market By Feedstock, 2022-2032, USD (Million)
TABLE 68 Rest of Europe Lignin Market By Production Process, 2022-2032, USD (Million)
TABLE 69 Rest of Europe Lignin Market By Carbon Fiber, 2022-2032, USD (Million)
TABLE 70 Rest of Europe Lignin Market By Carbon Nanofiber, 2022-2032, USD (Million)
TABLE 71 Rest of Europe Lignin Market By Application, 2022-2032, USD (Million)
TABLE 72 Rest of Europe Lignin Market By End-Use, 2022-2032, USD (Million)
TABLE 73 Asia Lignin Market By Feedstock, 2022-2032, USD (Million)
TABLE 74 Asia Lignin Market By Production Process, 2022-2032, USD (Million)
TABLE 75 Asia Lignin Market By Carbon Fiber, 2022-2032, USD (Million)
TABLE 76 Asia Lignin Market By Carbon Nanofiber, 2022-2032, USD (Million)
TABLE 77 Asia Lignin Market By Application, 2022-2032, USD (Million)
TABLE 78 Asia Lignin Market By End-Use, 2022-2032, USD (Million)
TABLE 79 China Lignin Market By Feedstock, 2022-2032, USD (Million)
TABLE 80 China Lignin Market By Production Process, 2022-2032, USD (Million)
TABLE 81 China Lignin Market By Carbon Fiber, 2022-2032, USD (Million)
TABLE 82 China Lignin Market By Carbon Nanofiber, 2022-2032, USD (Million)
TABLE 83 China Lignin Market By Application, 2022-2032, USD (Million)
TABLE 84 China Lignin Market By End-Use, 2022-2032, USD (Million)
TABLE 85 Japan Lignin Market By Feedstock, 2022-2032, USD (Million)
TABLE 86 Japan Lignin Market By Production Process, 2022-2032, USD (Million)
TABLE 87 Japan Lignin Market By Carbon Fiber, 2022-2032, USD (Million)
TABLE 88 Japan Lignin Market By Carbon Nanofiber, 2022-2032, USD (Million)
TABLE 89 Japan Lignin Market By Application, 2022-2032, USD (Million)
TABLE 90 Japan Lignin Market By End-Use, 2022-2032, USD (Million)
TABLE 91 India Lignin Market By Feedstock, 2022-2032, USD (Million)
TABLE 92 India Lignin Market By Production Process, 2022-2032, USD (Million)
TABLE 93 India Lignin Market By Carbon Fiber, 2022-2032, USD (Million)
TABLE 94 India Lignin Market By Carbon Nanofiber, 2022-2032, USD (Million)
TABLE 95 India Lignin Market By Application, 2022-2032, USD (Million)
TABLE 96 India Lignin Market By End-Use, 2022-2032, USD (Million)
TABLE 97 Australia Lignin Market By Feedstock, 2022-2032, USD (Million)
TABLE 98 Australia Lignin Market By Production Process, 2022-2032, USD (Million)
TABLE 99 Australia Lignin Market By Carbon Fiber, 2022-2032, USD (Million)
TABLE 100 Australia Lignin Market By Carbon Nanofiber, 2022-2032, USD (Million)
TABLE 101 Australia Lignin Market By Application, 2022-2032, USD (Million)
TABLE 102 Australia Lignin Market By End-Use, 2022-2032, USD (Million)
TABLE 103 South Korea Lignin Market By Feedstock, 2022-2032, USD (Million)
TABLE 104 South Korea Lignin Market By Production Process, 2022-2032, USD (Million)
TABLE 105 South Korea Lignin Market By Carbon Fiber, 2022-2032, USD (Million)
TABLE 106 South Korea Lignin Market By Carbon Nanofiber, 2022-2032, USD (Million)
TABLE 107 South Korea Lignin Market By Application, 2022-2032, USD (Million)
TABLE 108 South Korea Lignin Market By End-Use, 2022-2032, USD (Million)
TABLE 109 Latin America Lignin Market By Feedstock, 2022-2032, USD (Million)
TABLE 110 Latin America Lignin Market By Production Process, 2022-2032, USD (Million)
TABLE 111 Latin America Lignin Market By Carbon Fiber, 2022-2032, USD (Million)
TABLE 112 Latin America Lignin Market By Carbon Nanofiber, 2022-2032, USD (Million)
TABLE 113 Latin America Lignin Market By Application, 2022-2032, USD (Million)
TABLE 114 Latin America Lignin Market By End-Use, 2022-2032, USD (Million)
TABLE 115 Brazil Lignin Market By Feedstock, 2022-2032, USD (Million)
TABLE 116 Brazil Lignin Market By Production Process, 2022-2032, USD (Million)
TABLE 117 Brazil Lignin Market By Carbon Fiber, 2022-2032, USD (Million)
TABLE 118 Brazil Lignin Market By Carbon Nanofiber, 2022-2032, USD (Million)
TABLE 119 Brazil Lignin Market By Application, 2022-2032, USD (Million)
TABLE 120 Brazil Lignin Market By End-Use, 2022-2032, USD (Million)
TABLE 121 Mexico Lignin Market By Feedstock, 2022-2032, USD (Million)
TABLE 122 Mexico Lignin Market By Production Process, 2022-2032, USD (Million)
TABLE 123 Mexico Lignin Market By Carbon Fiber, 2022-2032, USD (Million)
TABLE 124 Mexico Lignin Market By Carbon Nanofiber, 2022-2032, USD (Million)
TABLE 125 Mexico Lignin Market By Application, 2022-2032, USD (Million)
TABLE 126 Mexico Lignin Market By End-Use, 2022-2032, USD (Million)
TABLE 127 Rest of Latin America Lignin Market By Feedstock, 2022-2032, USD (Million)
TABLE 128 Rest of Latin America Lignin Market By Production Process, 2022-2032, USD (Million)
TABLE 129 Rest of Latin America Lignin Market By Carbon Fiber, 2022-2032, USD (Million)
TABLE 130 Rest of Latin America Lignin Market By Carbon Nanofiber, 2022-2032, USD (Million)
TABLE 131 Rest of Latin America Lignin Market By Application, 2022-2032, USD (Million)
TABLE 132 Rest of Latin America Lignin Market By End-Use, 2022-2032, USD (Million)
TABLE 133 Middle East and Africa Lignin Market By Feedstock, 2022-2032, USD (Million)
TABLE 134 Middle East and Africa Lignin Market By Production Process, 2022-2032, USD (Million)
TABLE 135 Middle East and Africa Lignin Market By Carbon Fiber, 2022-2032, USD (Million)
TABLE 136 Middle East and Africa Lignin Market By Carbon Nanofiber, 2022-2032, USD (Million)
TABLE 137 Middle East and Africa Lignin Market By Application, 2022-2032, USD (Million)
TABLE 138 Middle East and Africa Lignin Market By End-Use, 2022-2032, USD (Million)
TABLE 139 GCC Lignin Market By Feedstock, 2022-2032, USD (Million)
TABLE 140 GCC Lignin Market By Production Process, 2022-2032, USD (Million)
TABLE 141 GCC Lignin Market By Carbon Fiber, 2022-2032, USD (Million)
TABLE 142 GCC Lignin Market By Carbon Nanofiber, 2022-2032, USD (Million)
TABLE 143 GCC Lignin Market By Application, 2022-2032, USD (Million)
TABLE 144 GCC Lignin Market By End-Use, 2022-2032, USD (Million)
TABLE 145 South Africa Lignin Market By Feedstock, 2022-2032, USD (Million)
TABLE 146 South Africa Lignin Market By Production Process, 2022-2032, USD (Million)
TABLE 147 South Africa Lignin Market By Carbon Fiber, 2022-2032, USD (Million)
TABLE 148 South Africa Lignin Market By Carbon Nanofiber, 2022-2032, USD (Million)
TABLE 149 South Africa Lignin Market By Application, 2022-2032, USD (Million)
TABLE 150 South Africa Lignin Market By End-Use, 2022-2032, USD (Million)
TABLE 151 North Africa Lignin Market By Feedstock, 2022-2032, USD (Million)
TABLE 152 North Africa Lignin Market By Production Process, 2022-2032, USD (Million)
TABLE 153 North Africa Lignin Market By Carbon Fiber, 2022-2032, USD (Million)
TABLE 154 North Africa Lignin Market By Carbon Nanofiber, 2022-2032, USD (Million)
TABLE 155 North Africa Lignin Market By Application, 2022-2032, USD (Million)
TABLE 156 North Africa Lignin Market By End-Use, 2022-2032, USD (Million)
TABLE 157 Turkey Lignin Market By Feedstock, 2022-2032, USD (Million)
TABLE 158 Turkey Lignin Market By Production Process, 2022-2032, USD (Million)
TABLE 159 Turkey Lignin Market By Carbon Fiber, 2022-2032, USD (Million)
TABLE 160 Turkey Lignin Market By Carbon Nanofiber, 2022-2032, USD (Million)
TABLE 161 Turkey Lignin Market By Application, 2022-2032, USD (Million)
TABLE 162 Turkey Lignin Market By End-Use, 2022-2032, USD (Million)
TABLE 163 Rest of Middle East and Africa Lignin Market By Feedstock, 2022-2032, USD (Million)
TABLE 164 Rest of Middle East and Africa Lignin Market By Production Process, 2022-2032, USD (Million)
TABLE 165 Rest of Middle East and Africa Lignin Market By Carbon Fiber, 2022-2032, USD (Million)
TABLE 166 Rest of Middle East and Africa Lignin Market By Carbon Nanofiber, 2022-2032, USD (Million)
TABLE 167 Rest of Middle East and Africa Lignin Market By Application, 2022-2032, USD (Million)
TABLE 168 Rest of Middle East and Africa Lignin Market By End-Use, 2022-2032, USD (Million)
Market Overview
The lignin market for carbon fiber and carbon nanofiber refers to a specialized segment within the broader material science and chemical industry, focusing on the use of lignin as a precursor material for producing carbon fibers and carbon nanofibers. lignin is a complex organic polymer found in plant cell walls, and it is typically a by product of the paper and pulp industry. Its use in carbon fiber and nanofiber production represents an innovative approach to creating advanced materials that are both sustainable and high-performing. Carbon fibers and nanofibers derived from lignin are used in various applications, including in the automotive, aerospace, and electronics industries, due to their strength, lightweight properties, and electrical conductivity. The lignin market for carbon fiber and carbon nanofiber is estimated to grow at a CAGR of 5.6% from 2024 to 2032. The lignin market for carbon fiber and carbon nanofiber is gaining attention due to the growing demand for sustainable and environmentally friendly materials. As industries seek alternatives to petroleum-based carbon fibers, lignin emerges as a renewable and cost-effective option. The market is driven by the increasing application of carbon fibers in various sectors for enhancing material performance, combined with a global push towards sustainable manufacturing practices.
Lignin Market For Carbon Fiber And Carbon Nanofiber Dynamics
Driver: Growing Demand for Sustainable and Cost-Effective Materials
The primary driver for the lignin market for carbon fiber and carbon nanofiber is the increasing global demand for sustainable and cost-effective materials, especially in industries like automotive, aerospace, and construction. Traditional carbon fibers are typically derived from petroleum-based precursors, which are not only expensive but also have a considerable environmental impact. lignin, being a by product of the paper and pulp industry, presents a more sustainable and lower-cost alternative. Its abundant availability and renewable nature make it an attractive material for producing carbon fibers and nanofibers. The shift towards green manufacturing practices and the growing emphasis on reducing carbon footprints are further propelling the demand for lignin-based carbon fibers. Industries are increasingly adopting these eco-friendly materials to meet environmental regulations and sustainability goals, thereby driving market growth.
Opportunity: Innovations in Material Processing and Application
An emerging opportunity in the market lies in the ongoing innovations in material processing and expanding applications of lignin-based carbon fibers and nanofibers. Research in enhancing the processing techniques of lignin to produce high-quality carbon fibers is opening new avenues in various high-performance applications. These innovations are aimed at improving the mechanical and thermal properties of lignin-based carbon fibers to make them competitive with traditional carbon fibers. The potential for these fibers to be used in high-tech sectors, including electronics and energy storage, presents significant opportunities for market expansion.
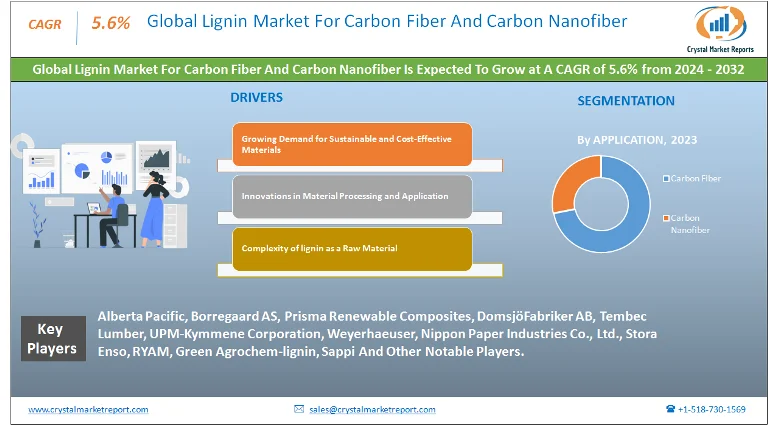
Restraint: Complexity of lignin as a Raw Material
A major restraint in the lignin market for carbon fiber and carbon nanofiber is the inherent complexity of lignin as a raw material. lignin's structure and composition can vary significantly depending on its plant source and the method of extraction. This variability poses challenges in achieving consistency and predictability in the quality of the resulting carbon fibers. The complex nature of lignin requires sophisticated processing technologies to convert it into a suitable precursor for carbon fiber production, which can be a limiting factor in the widespread adoption and scalability of lignin-based carbon fibers.
Challenges: Quality and Performance Consistency
The market faces a critical challenge in ensuring quality and performance consistency of lignin-based carbon fibers and nanofibers. Matching the performance characteristics of lignin-derived fibers with those of petroleum-based carbon fibers remains a significant hurdle. Achieving consistent strength, stiffness, and thermal stability in lignin-based carbon fibers is essential for their application in high-end and critical-use scenarios. The research and development efforts required to overcome these challenges are extensive and need to address not only the material properties but also the scalability and cost-effectiveness of production processes. Ensuring that lignin-derived carbon fibers meet industry-specific requirements and standards is crucial for their broader market acceptance and growth.
Market Segmentation by Application
In the lignin market for Carbon Fiber and Carbon Nanofiber, segmentation by application includes Carbon Fiber and Carbon Nanofiber. The Carbon Fiber segment is anticipated to exhibit the highest Compound Annual Growth Rate (CAGR) from 2024 to 2032. This can be attributed to the increasing adoption of carbon fibers in various high-performance applications due to their superior strength-to-weight ratio and stiffness. The growing use of carbon fibers in industries such as automotive, aerospace, and construction, driven by the demand for lightweight and strong materials, fuels this segment's growth. Despite the rapid growth of the Carbon Fiber segment, the Carbon Nanofiber segment generated the highest revenue in 2023. The unique properties of carbon nanofibers, such as high electrical conductivity and thermal stability, make them valuable in a range of applications, including electronics and energy storage, thereby accounting for their dominant revenue share.
Market Segmentation by End-use
Regarding market segmentation by end-use, the categories include Automotive, Energy, Aerospace, Sports, Marine, Electronics, Wastewater Treatment, among Others. The Automotive segment is expected to witness the highest CAGR from 2024 to 2032, driven by the increasing demand for lightweight materials to improve fuel efficiency and reduce emissions in vehicles. The incorporation of lignin-based carbon fibers in automotive components is a growing trend, contributing to this segment's growth. However, in 2023, the Aerospace sector accounted for the highest revenue. The stringent performance and safety standards in aerospace necessitate the use of high-quality materials, and the unique properties of lignin-based carbon fibers and nanofibers, such as their strength and lightweight nature, make them highly suitable for aerospace applications.
Market Segmentation by Region
In the geographic analysis of the lignin market for Carbon Fiber and Carbon Nanofiber, different regions exhibit distinct trends and potential for growth. The Asia-Pacific region is projected to display the highest Compound Annual Growth Rate (CAGR) from 2024 to 2032. This significant growth can be attributed to the rapid industrialization, increasing focus on sustainable materials, and growing automotive and electronics sectors in countries like China, Japan, and India. The region's commitment to environmental sustainability and the presence of a vast manufacturing base are key drivers of this growth. In contrast, in 2023, North America had generated the highest revenue in the market. This dominance is largely due to the advanced technological landscape, the presence of key industry players, and substantial investments in research and development activities, particularly in the United States and Canada. The region's focus on innovative material solutions for industries like aerospace, automotive, and energy has contributed to its leading position in revenue generation.
Competitive Trends
Regarding competitive trends and key players in the market, several companies stood out in 2023. These include industry leaders who have established strong positions through innovation, strategic partnerships, and a focus on developing sustainable and high-performance lignin-based products. Key players like Alberta Pacific, Borregaard AS, Prisma Renewable Composites, DomsjöFabriker AB, Tembec Lumber, UPM-Kymmene Corporation, Weyerhaeuser, Nippon Paper Industries Co., Ltd., Stora Enso, RYAM, Green Agrochem-lignin, and Sappi have been instrumental in driving the market forward. Domtar Corporation, for example, focused on sustainable forestry and the production of high-quality lignin for various applications. Borregaard ASA, a leader in biorefinery operations, has been at the forefront of developing innovative lignin-based products for a range of applications. Lignol Energy Corporation has dedicated significant efforts to research and development, particularly in the field of advanced biofuels and biochemicals derived from lignin. From 2024 to 2032, these companies are expected to continue their emphasis on sustainability, expanding their product portfolios, and exploring new applications in emerging markets. Their strategies are likely to include further research into optimizing lignin processing techniques and expanding the commercial viability of lignin-based carbon fibers and nanofibers. The combined revenue of these companies in 2023 underlines their substantial impact on the market, and their ongoing activities are anticipated to significantly shape the market dynamics over the forecast period. This competitive landscape highlights a market driven by technological advancements, a growing emphasis on sustainable materials, and the diversification of applications for lignin-derived products in various industries.